Monitoring
Monitoring some metrics using Java Melody
Java Melody
Java Melody is an open source tool for monitoring JAVA EE web applications
With this you will be able to :
- monitor average response times and number of executions
- make decisions before problems become too serious
- optimize based on the more limiting response times
- find the root causes of response times
- verify the real improvement after optimizations
https://github.com/javamelody/javamelody/wiki
Configuration of Java Melody
Java Melody is already integrated in OSCAR 15, but certain steps must be taken to enable it's operation
1) Server must be using SSL
2) Turn on headless (add to CATALINA_OPTS)
-Djava.awt.headless=true
3) Create a user, and add them to "monitoring" role. This is done in tomcat-users.xml. for example. This secures the monitoring to those who provide the credentials.
<user username="admin" password="*****" roles="monitoring"/>
4) Turn on your instance in the monitoring filter section of var/lib/tomcat7/webapps/oscar/WEB-INF/web.xml. for example so it looks like
<filter>
	   <filter-name>monitoring</filter-name>
	   <filter-class>net.bull.javamelody.MonitoringFilter</filter-class>
	   <init-param>
	   	   <param-name>system-actions-enabled</param-name>
	   	   <param-value>true</param-value>
	   </init-param>
	   <init-param>
	   	   <param-name>disabled</param-name>
	   	   <param-value>false</param-value>
	   </init-param>
</filter>
5) If OSCAR is not reloaded with this change, you will need to restart tomcat
Now access your server with /monitoring in the url, so for example
https://localhost:8443/oscar/monitoring
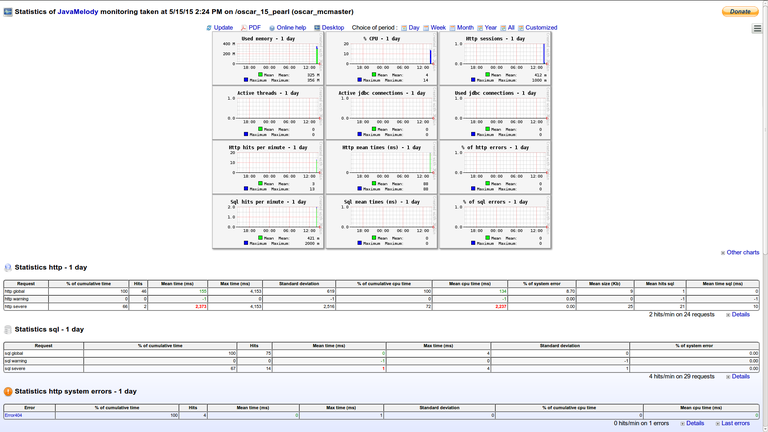
and you should see
